Election results
The election result: one last look
Ipsos-Mori has released its traditional post-election breakdown of how the country voted. As usual, all the voting intention figures are weighted according to the actual results, combined with turnout on a regional level.
There will many more of these kinds of surveys and investigations over the next few months and years, but few that will draw upon a similar size of data (9,000 respondents) and which can command such a historical pedigree (Ipsos-Mori has been publishing these post-election snapshots since 1979).
The figures show just how cleanly and efficiently the Conservatives managed to secure a victory.
Take age, for example. Labour led the Conservatives among 18-34 year olds, but in no other age group whatsoever. The Tories had an enormous 24-point lead among voters aged 65 and over:
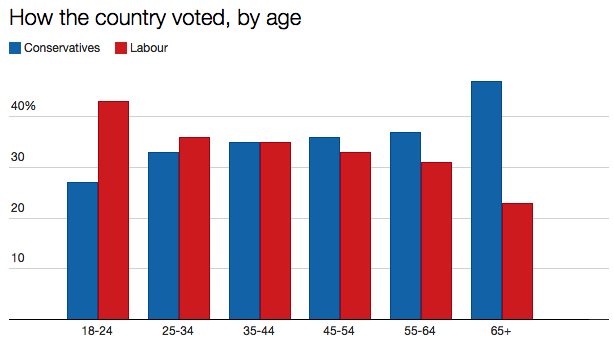
There was a swing of 5.5% from Labour to the Conservatives among the 65+ age group. There was a bigger swing of 7.5% in the other direction among 18-24 year-olds. But only 43% of that age group bothered to vote, while a massive 78% of voters aged 65+ did.
The only social class in which Labour led the Conservatives was DEs:
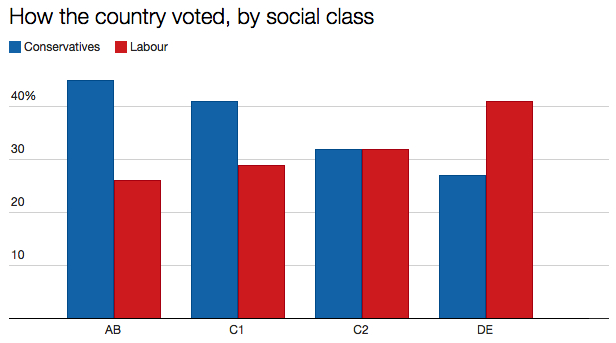
The Tories had a 19-point lead over Labour among AB voters, where turnout was 75%. Turnout among DEs was just 57%.
When you split support on the basis of housing, it’s a similar picture:
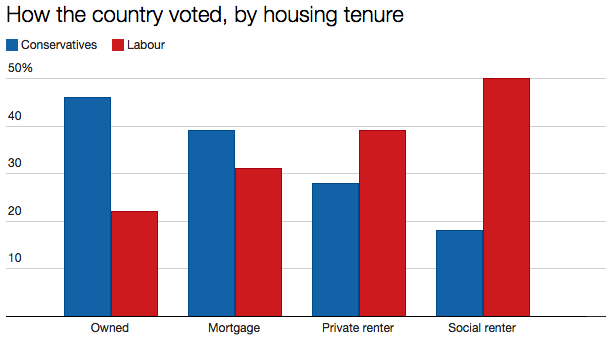
Guess which of these groups saw the highest turnout? Of course: owners, 77% of whom voted. By contrast, a measly 51% of voters renting social housing cast a ballot.
When you analyse voting intention in this way, there’s no mystery why the Tories ended up with a majority. It got more people to support it – and got more of them to vote for it – than did Labour. The real mystery is why this wasn’t picked up by the opinion polls, and for the answer to that we’ll have to wait for the findings of the official inquiry, which will be published by next March.
The Conservatives held on to 82% of those who said they voted for the party in 2010; Labour managed to hold on to only 72%. But that’s a far sight better than the Lib Dems, who held on to barely a third of their 2010 vote, losing it in all directions: 24% to Labour, 20% to the Tories, 11% to the Greens and even 7% to Ukip. I’d like to meet the people who voted Lib Dem in 2010 but who have since travelled right across the spectrum and voted Ukip this year.
Ipsos-Mori’s research is a good starting point for better understanding what happened on 7 May. It’s also a good end point for this blog. I’m going to keep hold of this web address and may return to write about future elections. Next year promises a bounty of polls, including contests for the Scottish parliament, Welsh assembly, Northern Ireland assembly, London mayor, local councils and possibly the EU referendum as well. But for now I’d like to thank everyone who has looked at the blog and who has left comments over the past year. I hope you’ve enjoyed what you have found.

From one self-diagnosed “election obsessive” to another: goodbye and thank you for the enormous effort you have put in! I only wish I had discovered this blog sooner (though it gave me the chance to go on a huge archive binge of course).
Thanks for all the effort you put in: your blog was essential reading as far as I was concerned. I’m secretly hoping you have a similar amount of time and desire around, say, 4 years from now 🙂
Thanks for the blog. It’s been a good read.
My view is that we should perhaps move on from national opinion polls as I think Uniform National Swing has gone for the foreseeable future. We will need constituency polls and marginal polls and regional polls. Obviously we will have Welsh and Scottish and London polls for the elections next year.
Some voted LD up to 2010 as an anti establishment vote but LDs became an establishment party after entering coalition meaning some of this vote probably went to UKIP in 2015.
Once again thank you for the blog. We can all look forward to next year’s elections and then the boundary review findings for GE2020.
Thanks, too, for the great blog – I thought rationing yourself to one post a day was really effective in making it focused and it was a highly informative read. Hope you’ll be back at the next election!
Yes, thanks for a great and informative blog1
The mention of Lib Dem voters going to UKIP reminds me of the moment during the Beeb’s coverage of the 1979 election where David Dimbleby talks about the collapse of the National Front and says that the figures for October 1974 showed that when the Liberals started standing in seats they hadn’t done in the previous election, the National Front vote collapsed suggesting loads of people who voted for them then voted Liberal instead, and that to look at that you would assume “the voters must be demented” to have made such a dramatic flit across the political spectrum. David Butler says that a lot of that was probably down to some voters just wanting to vote for any party that wasn’t Tory or Labour just to be different.
And may I join the other commenters in thanking Ian for this fantastic blog.
Were the polls so very wrong?
See this, for context – http://commonslibraryblog.com/2015/05/22/how-much-did-the-polls-vary-from-the-general-election-result/
Thanks for all the comments, folks. Glad you’ve enjoyed reading the blog.
Ian, I don’t know what your day job is, but you’d make a great political editor for any serious news organization. And you did a much better job making sense of this election than anyone else I saw. Thank you