Opinion polls
How the poll of polls has changed
I’ve now been running a poll of polls on the blog for over a month, based on a seven-day rolling average of all the latest nationwide polls.
Here’s how the ratings for the five main parties have changed since early March:

It’s no real surprise to see the Tories and Labour locked together all the way, but note how their respective scores have drifted up slightly. The combined share for both parties one month ago was 63.5%; now it’s 67.9%.
At the same time, the Greens’ decline is pretty clear to see. They’ve gone from 6.3% to 5.1%. The Lib Dems have edged up very slightly, while Ukip has gone from 14.7% to 13.1% then back up to 13.8%.
This kind of graph makes for a telling comparison with the one I put on the blog a few days ago, which showed the results of every individual poll over the same period:
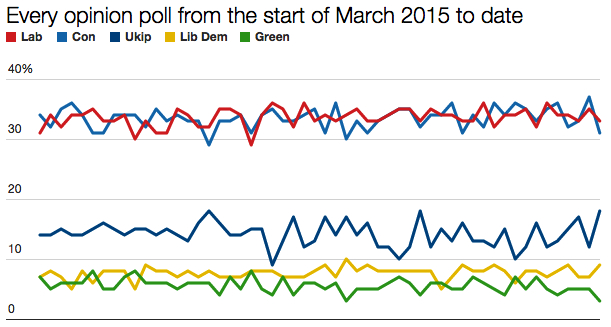
The poll of polls is arguably a more useful snapshot. It flattens out the trends and avoids all the noise that inevitably comes with a sequence of dozens of bespoke polls – as someone rightly commented here recently.
Watch to see how the poll of polls changes over the remainder of the campaign. I wouldn’t be surprised if we didn’t see the Greens below 5% fairly soon.

OK, well that reduces the shot noise! But it would be interesting to see some proper statistical analysis of the sampling errors quoted by the original polls (plus or minus 3 percentage points looks about right), and the estimated errors in your poll of polls (you should reduce the errors by something like the square root of 7, so a factor of about 2.5 or 3). On that basis, a shift of one percentage point would be barely significant.
The 3% margin of error figure is really a bit of an overestimate in most cases. For vote shares much smaller than 50%, the margin of error gets smaller. For the Greens, who are close to 5%, MoE is actually around 1%, and for a poll of polls it would be closer to 0.4%. So a 1% change in Green VI would definitely be statistically significant.
I don’t disagree – you can see from the graph that there is a clear change! – but at what level of statistical significance? Is your 0.4 percentage points equivalent to one standard deviation (so 1 percentage point is about 2.5 sigma), or 95% confidence, or something else?