Election campaign
How the size of the Commons has changed since the first world war
Had David Cameron and Nick Clegg not fallen out over reform of the House of Lords, the 2015 general election would have seen the number of MPs in the House of Commons fall to its lowest figure for over 100 years.
The government’s proposal to reduce the total from 650 to 600 would have left the Commons with fewer members than even the period immediately after the first world war, when constitutional and military upheaval saw the number of MPs plunge to 615.
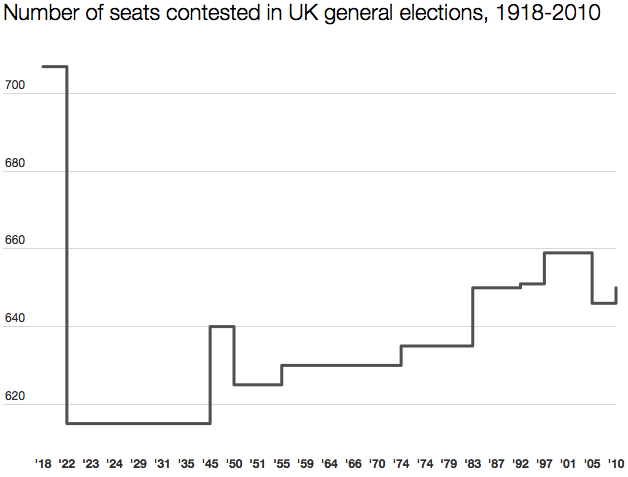
The election following the end of World War One in 1918 had returned the biggest parliament in British history: a whopping 707 MPs (and coincidentally, a Tory-Liberal coalition government).
But as this graph shows, the total quickly fell when the Irish Free State left the Union, dropping to 615 at the 1922 election where it remained until 1945:
As the end of the second world war approached, it was obvious the electoral map of Britain needed redrawing to account for the increase in population since 1918.
To do this, the 1944 Redistribution of Seats Act was passed. It established permanent boundary commissions for each of the UK nations, as well as providing for periodic reviews of the number and boundaries of parliamentary constituencies.
It specified that Great Britain was to have not substantially greater or less than 591 constituencies, while Northern Ireland was to have 12. It also allowed for the temporary creation of new constituencies for the 1945 election, to reflect population growth.
All of this meant that the number of MPs returned at the 1945 election rose for the first time since 1922, to a total of 640.
The 1948 Representation of the People Act then formalised the total, setting the number at 625 where it remained unchanged until 1955. A few small revisions produced a new total of 630, which stayed in place for a long period until the election of February 1974.
Since then the total has risen in line with the population, first to 635, then 650, then 651, then 659 in 1997: the highest number since 1918.
In 2005 the total was brought down to 646, when the number of seats in Scotland was reduced following the re-establishment of the Scottish parliament. A net gain of four seats in England brought the total back to 650 for 2010 – as it will be again in 2015.
The traditional calculation used by the boundary commissions is one MP for every 92,000 people, or 68,000 electors. The 2011 Parliamentary Voting System and Constituencies Act sought to replace this calculation by fixing the number of MPs at 600, forcing the commissions to in effect work backwards and carve up the country arithmetically rather than geographically.
But then came the spat over the House of Lords, and the Lib Dems decided to take revenge on the Tories for blocking reform by staging a vote in parliament in January 2013 that delayed the implementation of a boundary review based on 600 seats. But the legislation remains on the statute book, and the next boundary report, which will again be conducted on the basis of reducing the total to 600, is obliged by law to be published by October 2018.
Given the strong likelihood of another coalition government taking office after the 2015 election, controversy over the size of the Commons will almost certainly be back.

When plotting their revenge, the Lib Dems also had in mind, perhaps, the damage to their number of seats which would have been caused by a reduction in the total. Self interest is seldom far from the minds of politicians!